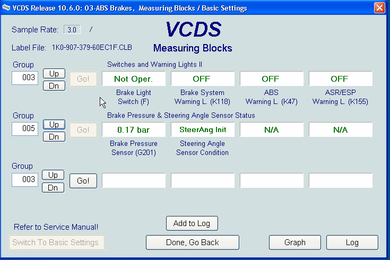
All available live data can be displayed using VCDS.
The data is displayed in table form with the values clearly labelled.
Under each value is text which indicates what the value is. Some values also have popup help with other useful information such as test conditions, standard values etc
Air flow, and other sensor values are shown with wanted and actual values together so testing MAF sensors, pressure sensors and other variable output type sensors is easy
You can save or log values to view minutes, days or even months later You can even email or print them at the click of a button

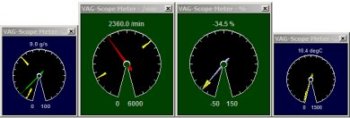
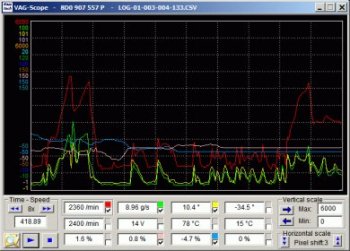
Live Sensor Data can also be viewed as gauges like these and also as a virtual oscilloscope like this


Authorised supplier for Ross-Tech VCDS, HEX GS-911 and AutoM3 VAUX-COM diagnostic tools
Tel: 01726 884 010 / Email us / Visit our On-line Shop